How to explore and use Command Central - An Actionable Insights Dashboard (For channel partners only)
The all-new Command Central - an actionable insights dashboard saves time with at-a-glance summaries divided into Adoption, Business performance, and Alerts. View the number of products, CRM integrations, and social channels enabled. Check out all businesses' ratings, ratings distribution, and review response rates. Get error alerts, fix issues before they become problems or lost businesses, and view other important insights with configurable dashboards.
Command Central (Overview)
The all-new ‘Overview’ page with the Command Central dashboard is set to be the new version of the homepage. This Command Central dashboard is equipped with key metrics across your business locations. Let’s dive into it and understand the actionable and important insights it delivers.
Adoption
Under the ‘Adoption’ section, you will view the sub-section ‘Products enabled.’ The numbers under products enabled represent the adoption of products among businesses you manage.

Click on ‘Three vertical dots’ to download and save the metrics in the pdf format.

NOTE:
All three vertical dots mentioned in every section on the overview page will let you download the metrics of that particular section in PDF format.
Click the ‘Numbers’ under the ‘Products enabled’ section to view the businesses that have enabled Reviews and Inbox.

Here’s how the business names will appear that have enabled products.

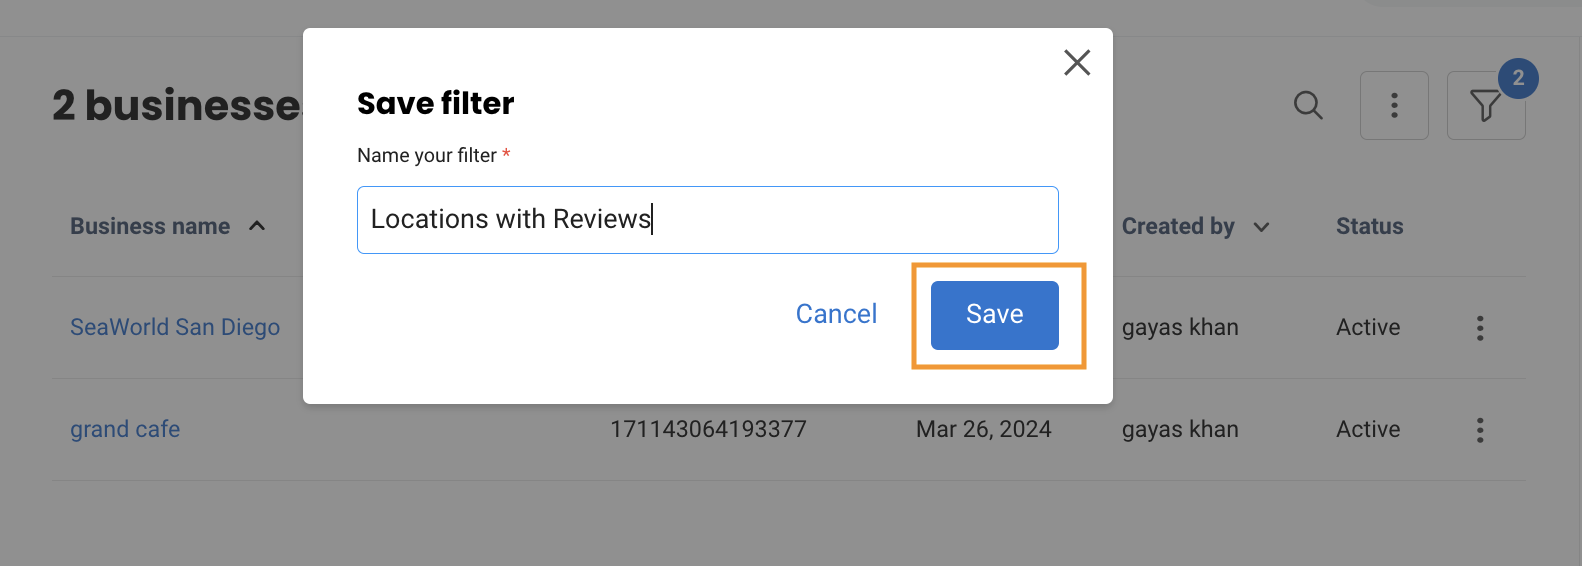
You can also save this view as a custom view. For example, these are the locations that have Reviews enabled. In case you need to save this information. Go to 'Filters.'

Click ‘Save.’

Provide the name of the filter and click ‘Save.’
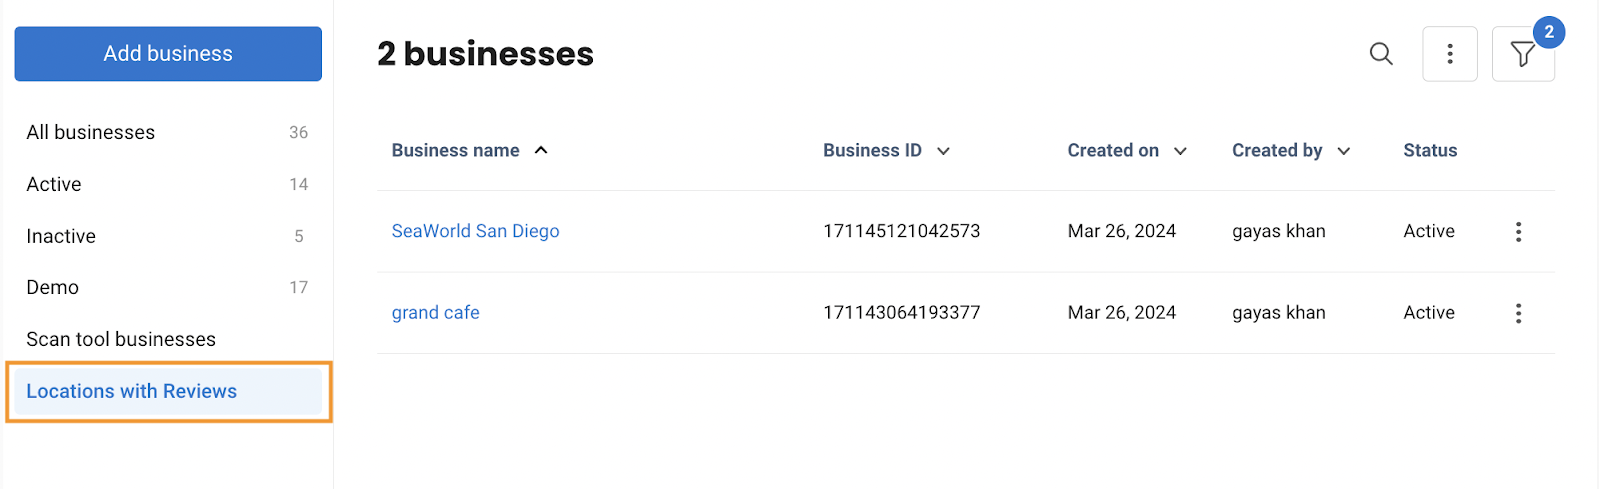
View and access the saved filter under the ‘Businesses’ tab on the left navigation rail.
NOTE:
You can save custom filters for all the sections in a way similar to the products enabled section, as shown above. Click the numbers represented below the section and use the filters icon to save the filter except for the ‘Listings, top-rated, and lowest-rated businesses’ sections, which we will explore below.
Under the ‘CRM integrated’ section, you can view the number of locations integrated with CRM in blue, and the red number represents the locations not integrated with CRM. Click on 'Numbers' to see which locations have integrated with CRM and which have not.

Explore the number of locations connected with social channels such as Google and Facebook. The number in blue under the ‘Google connections’ refers to the locations connected with Google, i.e. 100/150. The number in red represents the locations that are not connected with Google. Click the red color number, and you can view the 50 locations that are not connected. Similarly, click the number in blue color to view the 100 locations that are connected.
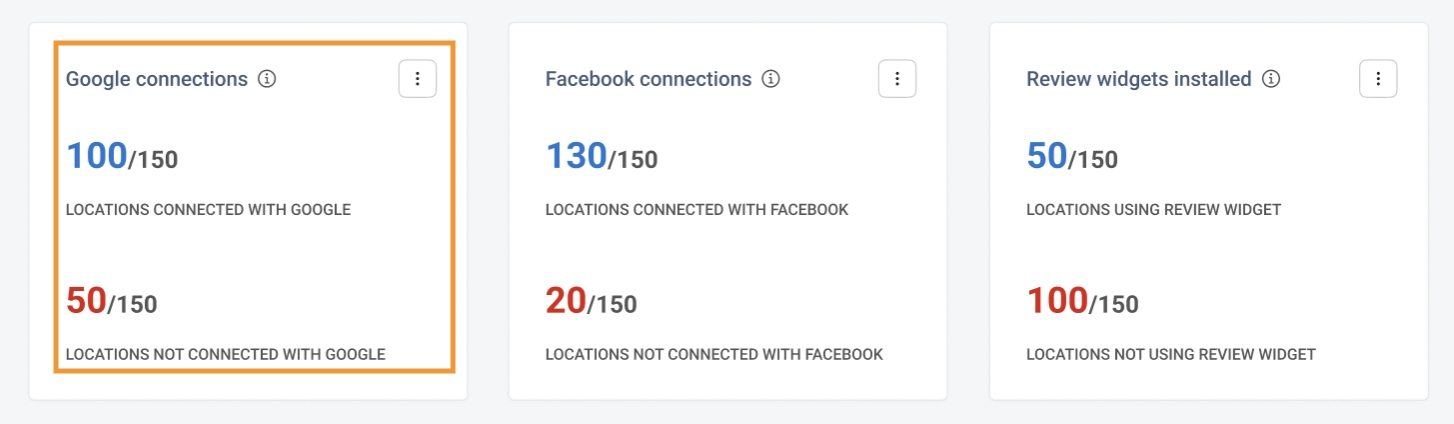
Similarly, you can view the number in blue as locations with ‘Review widgets installed’ and the number in red as locations not using the review widget.

NOTE:
Numbers mentioned under all the sections are clickable.
Business Performance
Under the Business Performance section, you can view the ‘Business ratings.’ You will view the average rating of businesses and businesses that have been rated 3 stars or less.

View the average review response rate as a percentage of reviews that have been addressed across businesses in the past 30 days.

Scroll down a little on the same section and you can view the number of businesses with unresponded reviews. Click on the number to view the businesses that haven’t responded to reviews.

Distribution of ratings across all businesses, showcasing the variety of customer experiences and satisfaction levels. You can also check out the ratings' distribution of unresponded reviews and quickly respond to reviews.

View the list of top-rated businesses and lowest-rated businesses. Click on the business name and it will redirect you to that particular business’ profile.

View the number of listings that have been synced, submitted, need updates, and opted out.

Alerts
View and fix broken connections. Click the number and view locations with disconnected Google and Facebook pages and quickly connect them.
Also, view the businesses with no review response automation and businesses with no response to the low-rated reviews.

Explore and view the number of businesses at risk due to no reviews or logins and with no new contacts added in the past 30 days.

Central Command Configuration and Customization
The entire Central Command dashboard on the 'Overview’ page is configurable and customizable. Click ‘Actions’ and then click ‘Edit.’

Click the ‘Customize’ icon.

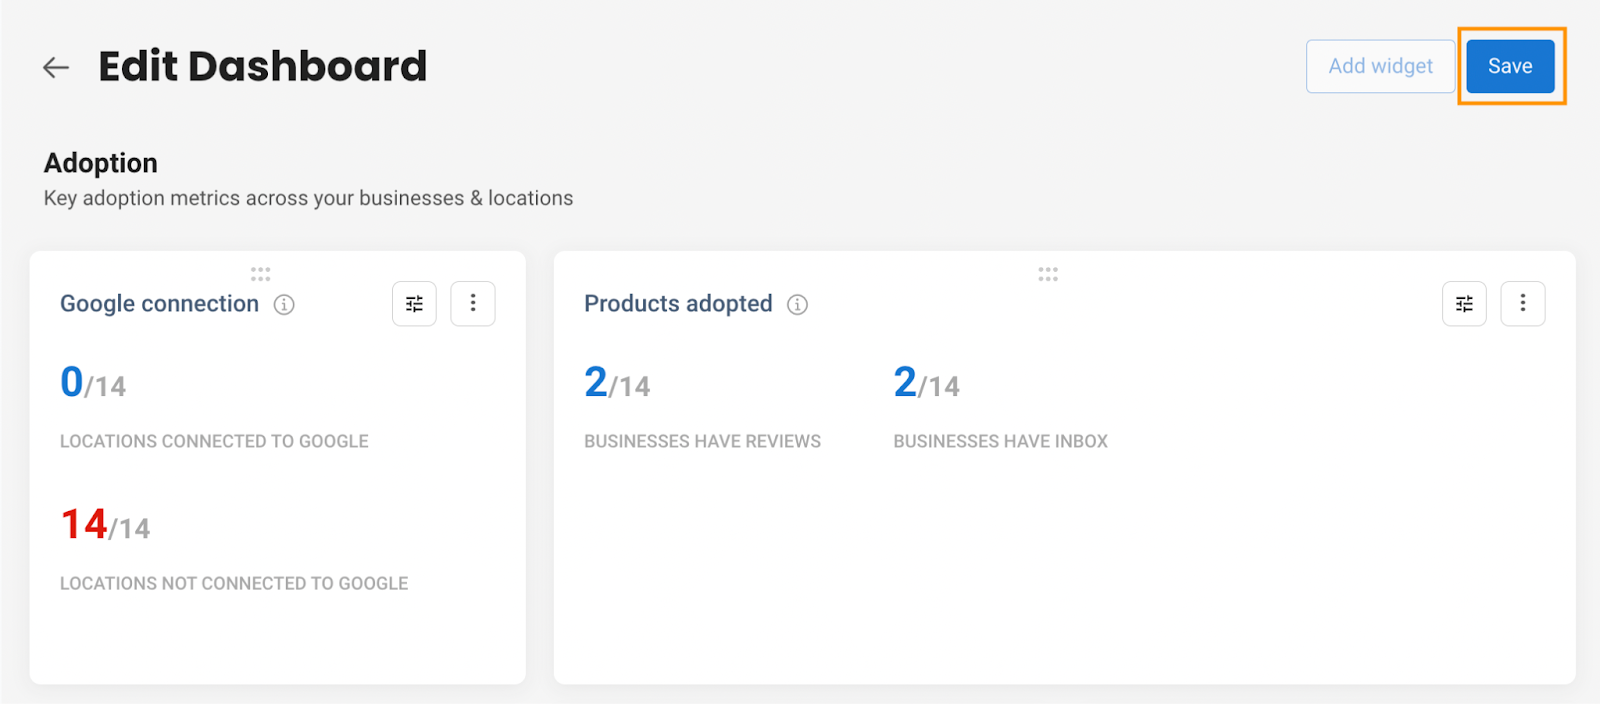
You can customize the section, have control over the products that you want to see on the dashboard, simply check and uncheck the products under the ‘Products’ tab. Change the title of the section. For example, the title was ‘Products enabled’ and I changed it to ‘Products adopted.’ You can also switch the ‘Display unit’ from number to percentage. Click ‘Update’ once the changes are done.

Hover over the ‘Icon highlighted’ below and then drag and drop to move the sections. Place the sections according to your preference.

Click on ‘Three vertical dots’ to remove or delete the section.

Go to the bottom of the dashboard or click ‘Add widget’ on the top corner of the dashboard to add another section.

Select the ‘Section, Widget, Activity,’ provide the ‘Title,’ and click ‘Save.’

Once the dashboard is customized, click ‘Save’ on the top corner of the dashboard.
Click ‘Actions’ and select ‘Download’ to download all the widgets on the dashboard.

NOTE:
If the dashboard contains more than 5 widgets then it may take a little while to download.
Click ‘Email’ to send a dashboard report to yourself, or an internal user.

You can email the dashboard insights to multiple users. Enter the name or email id under the recipients section to select the user. Once done, click ‘Send.’
