How do I read the report on Ticket Management?
Support tickets serve a variety of benefits right, from addressing customer issues to creating best practices for future product development. With Birdeye's deep analytical tools, you can look at the speed and the professionalism of your customer service with microlens. Birdeye automatically populates organized reports from your ticket support history and makes it available for you to take the best decisions to build the future roadmap for your business.
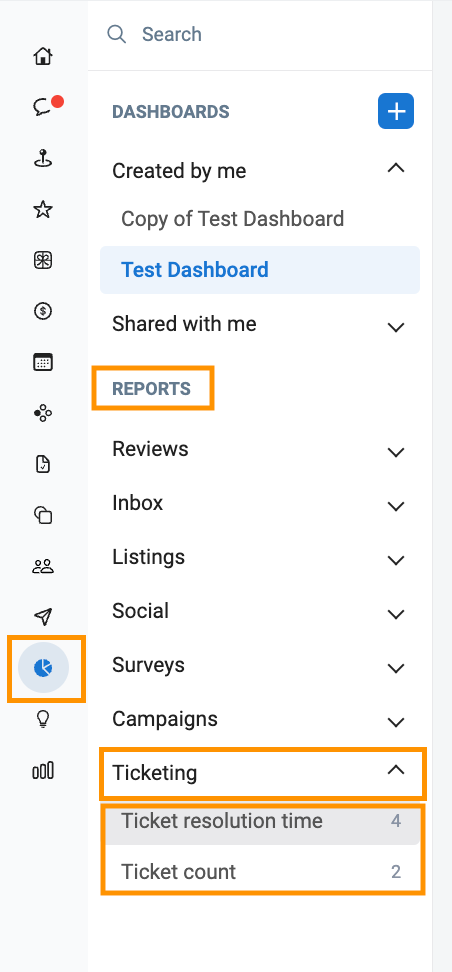
To view the report on ticket management within your dashboard, click on the 'Reports' tab on the left navigation rail of your Birdeye dashboard. Once on the 'Reports' page, click on the 'Ticketing’ down arrow under the ‘Reports' section on the left navigation rail.
Pre-set reports designed to examine ticketing metrics are available. These reports enable the tracking of ticket-related information and are categorized into two sections: one focusing on the time taken for ticket resolution, i.e. 'Ticket resolution time' and the other on the count of tickets 'Ticket count'.
Analysis of ticket resolution can be conducted based on location, over time, status and owner to identify trends. Additionally, the study of ticket count can be performed based on the ticket owner and the status of the ticket.
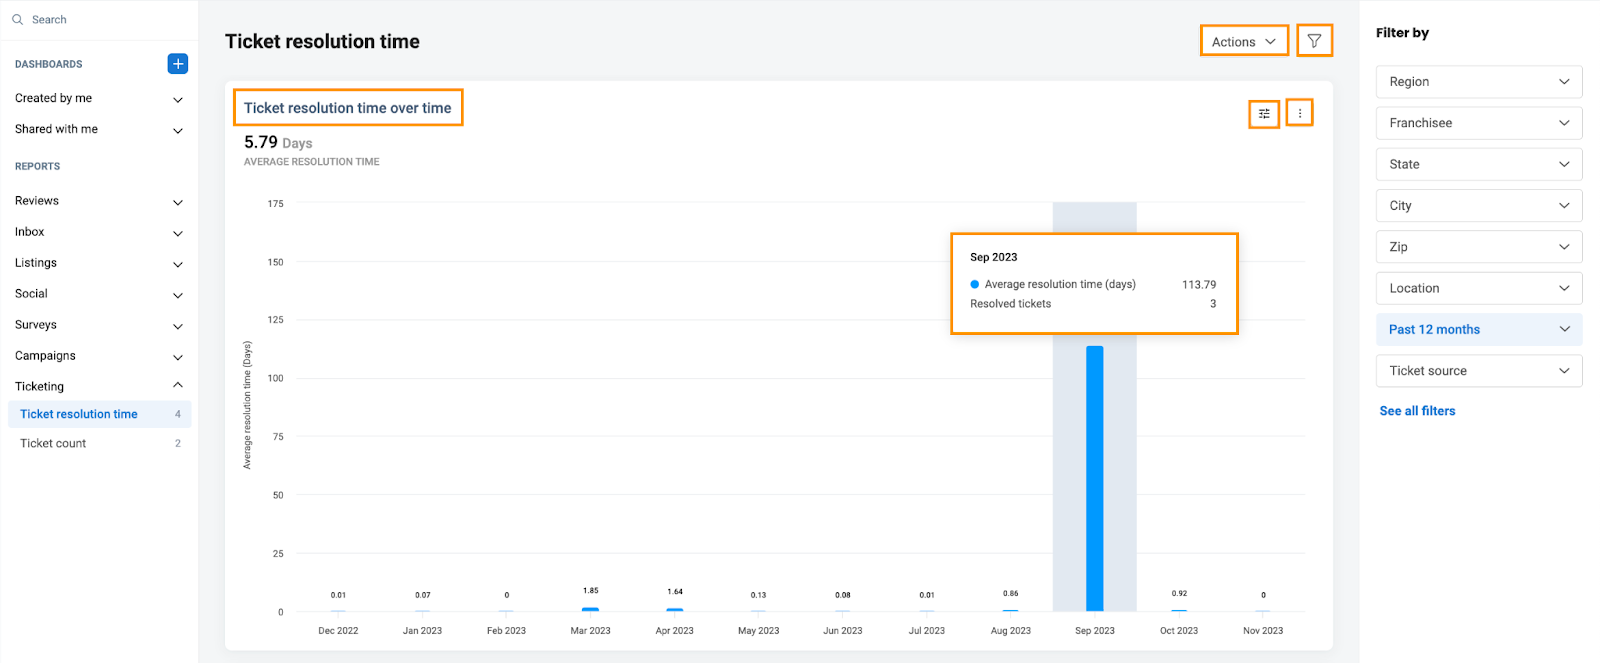
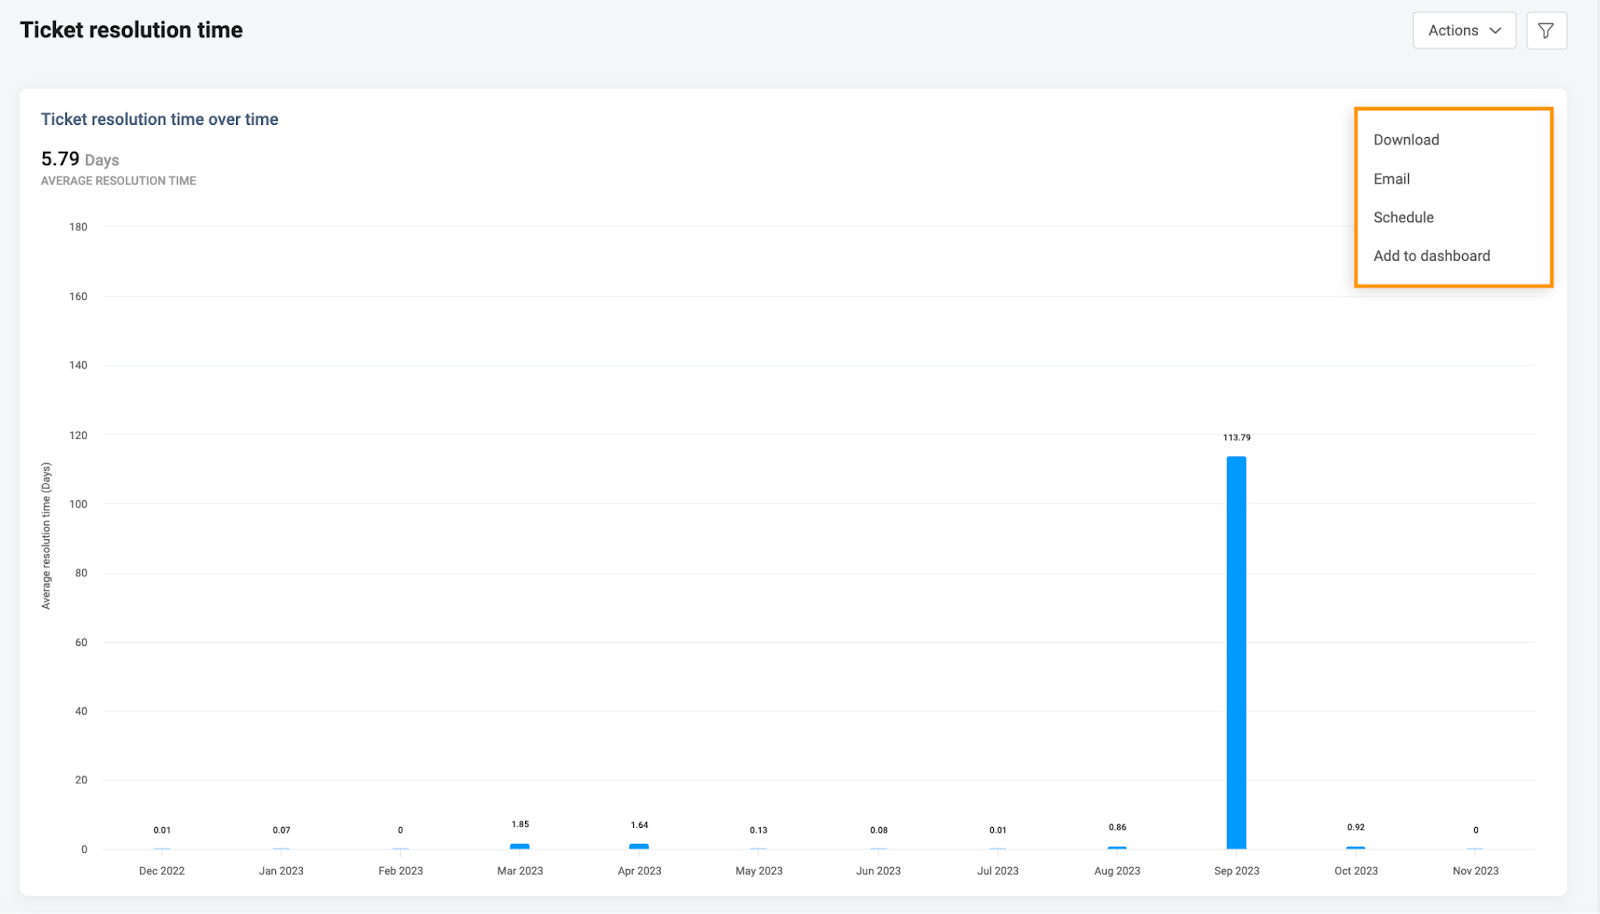
To view the report based on ticket resolution time over time, click on the 'Ticket resolution time' option under the 'Ticketing reports' drop-down menu. By default, the report provides you with the average ticket resolution time in a day-wise distribution format. You can hover over any bar to read the statistical information. You also have the ability to view the information in a day/hour-wise distribution format.
Select the funnel-shaped icon labeled 'Global filters,' and you'll access the 'Filter by' section to apply filters, allowing you to slice and dice the data for more effective analysis.
Additionally, a customization icon allows you to personalize the report. The three-dot icon provides options to download, email and schedule the report. Additionally, it offers functionality to add this report to your personally created dashboard.
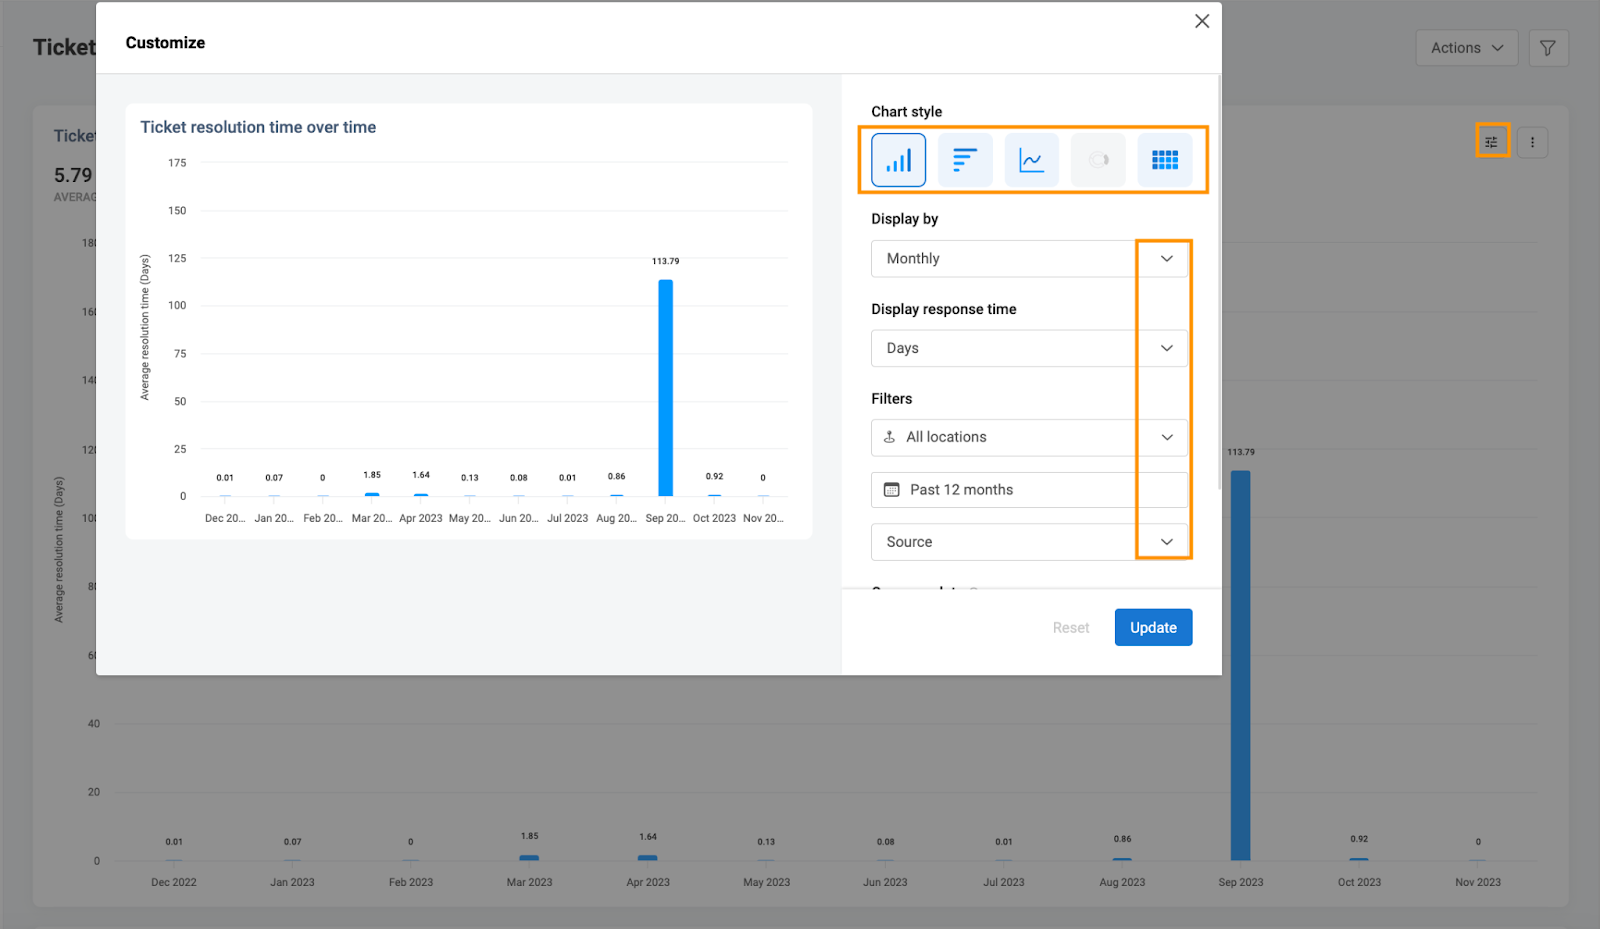
To personalize the report, simply click on the 'Customization' icon, and a pop-up screen will appear.
Chart Style: You can enhance the visual appeal of your report by selecting different chart styles for optimal viewing.
Displayed by: Daily, Weekly, Monthly, Quarterly and Yearly.
Display response time: Days, Hours and Minutes.
Filters:
- All locations: You can select any location.
- Past 12 months: You can select the report at any time, as shown in the image.
- Source: Social, Surveys, Reviews, Others.
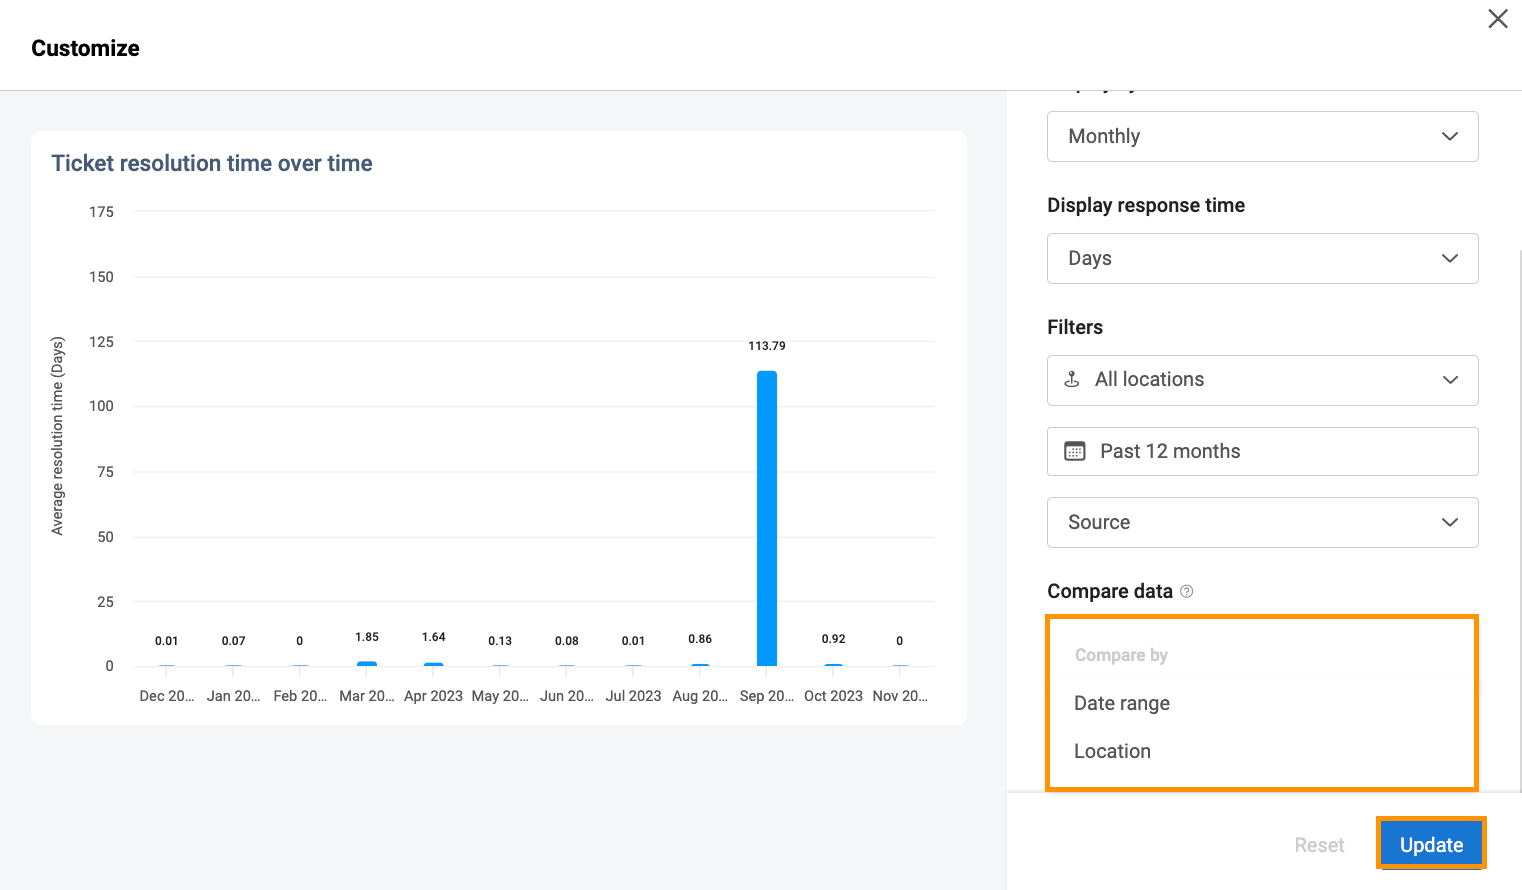
Compare data: The ability to compare reports in two dimensions: by location and by date range. Now, you have the flexibility to make insightful comparisons within your reports.
After making customizations, click on 'Update' to apply and save the changes to the report.
To learn about understanding creating dashboards within the 'Reports' section, incorporating multiple reports across all modules, refer to the article: A comprehensive guide to Birdeye Dashboards.
- Email: You can get the report in PDF and XLS formats.
- Schedule: Schedule the report via email in both PDF and XLS formats. You can also set the frequency.
- Download: You can download the report in Excel and PDF formats.
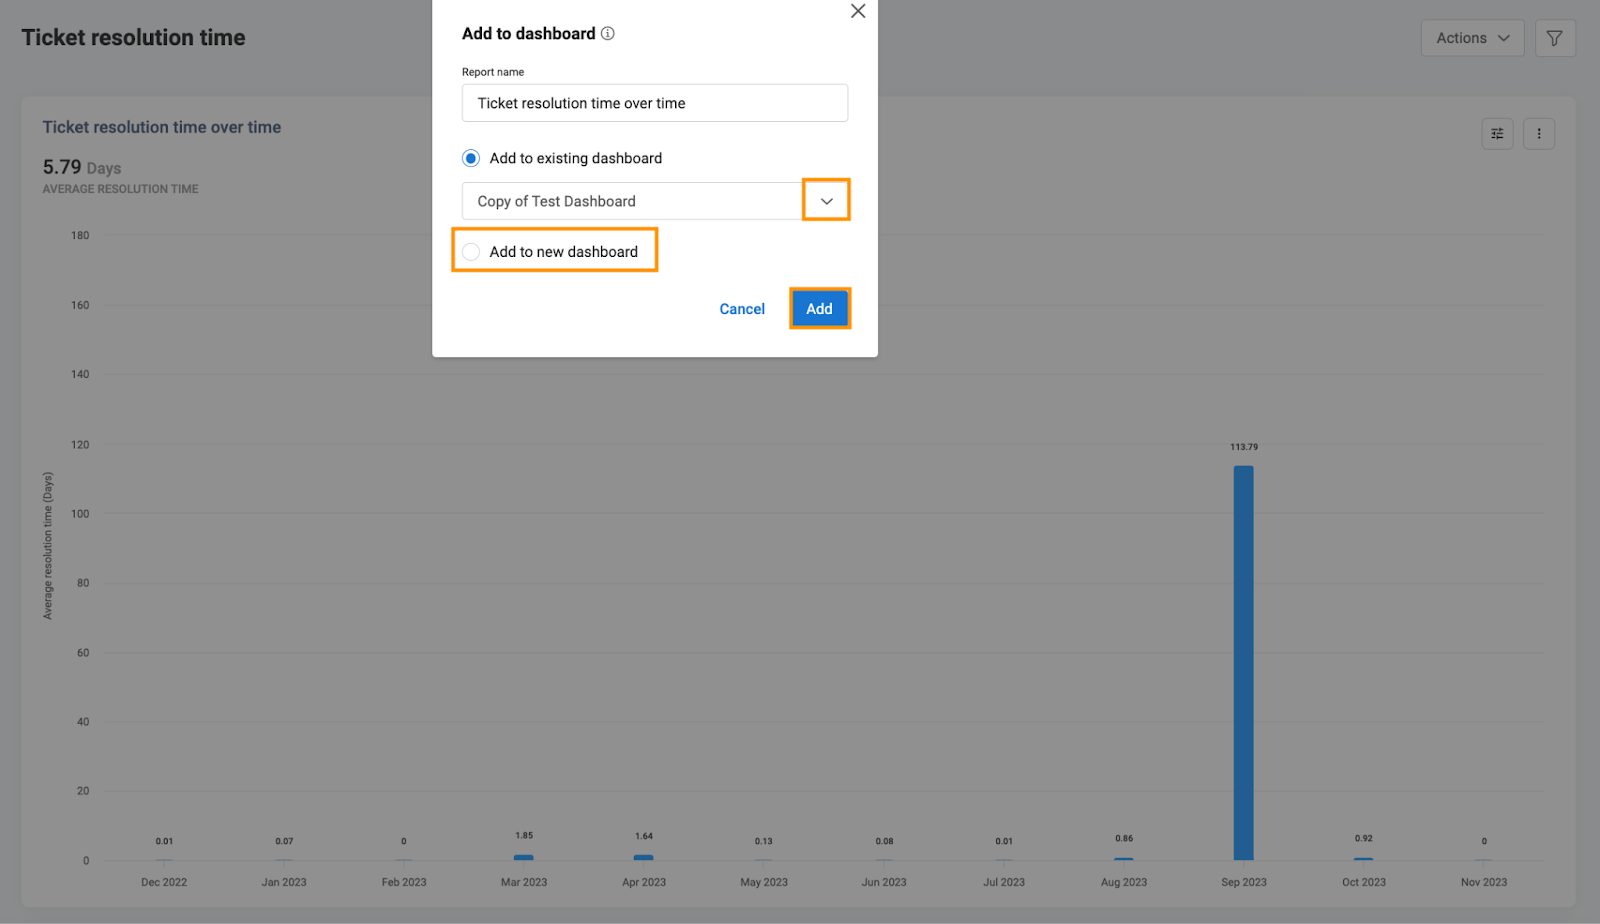
- Add to dashboard: You have the option to add this report to your dashboard. Upon clicking, a pop-up will appear on your screen, allowing you to add it to an existing dashboard or create a new one. Once you've made your selection, click 'Add' to include it in your preferred dashboard.
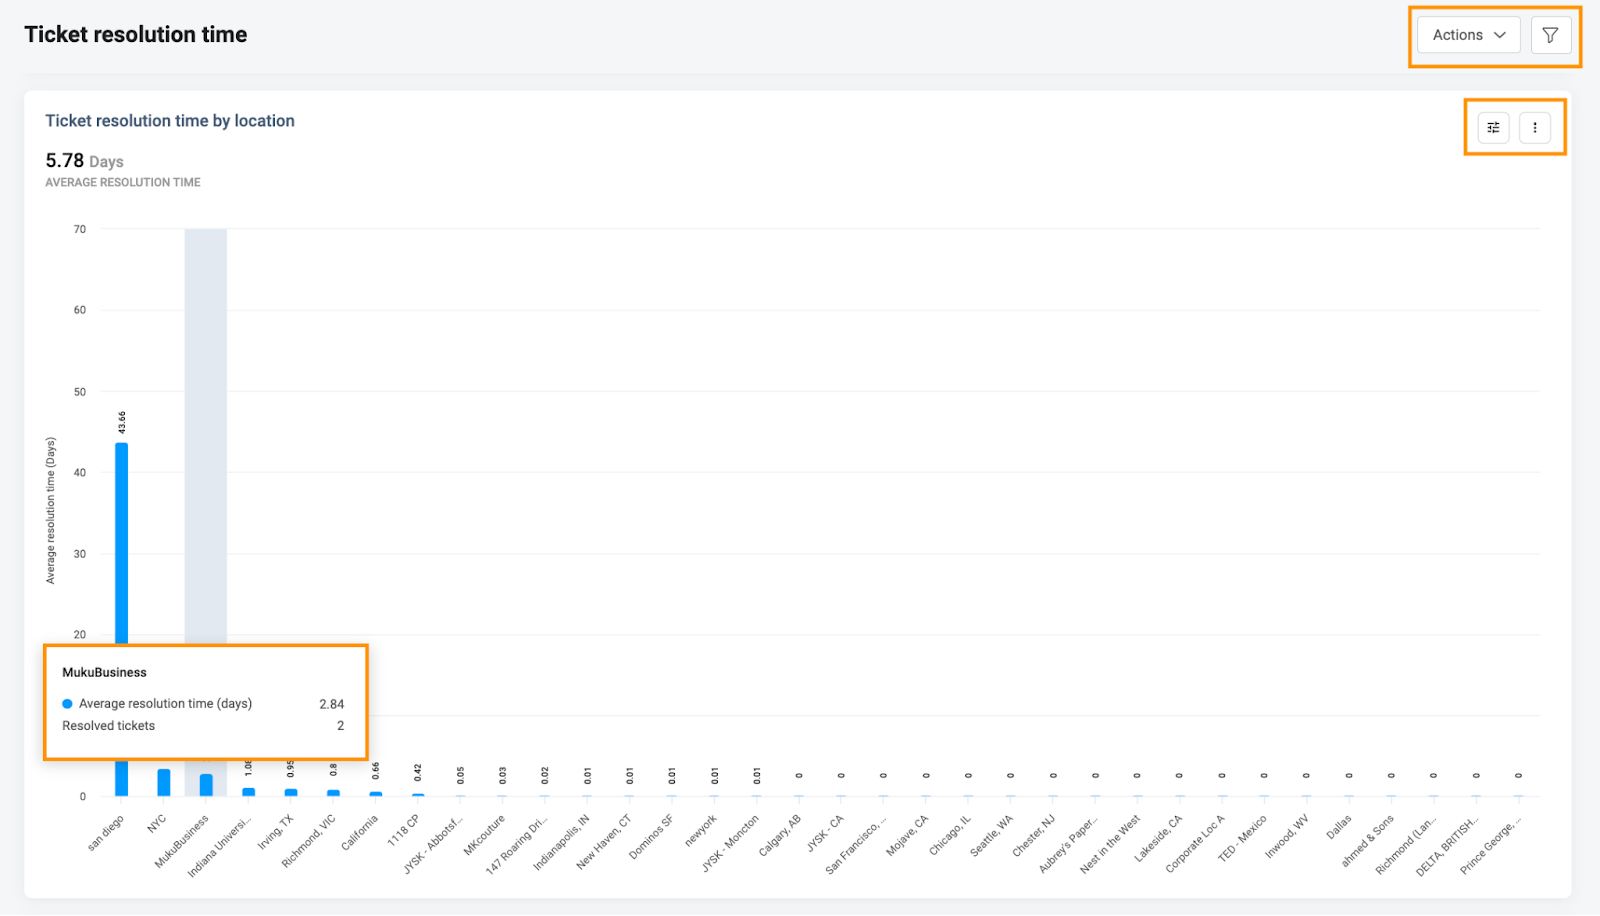
To view the report on average resolution time by location, scroll down to the 'Ticket resolution time by location' option. This report can help you monitor trends based on average resolution time for different locations associated with your Birdeye account. You can hover over any bar to read the statistical information.
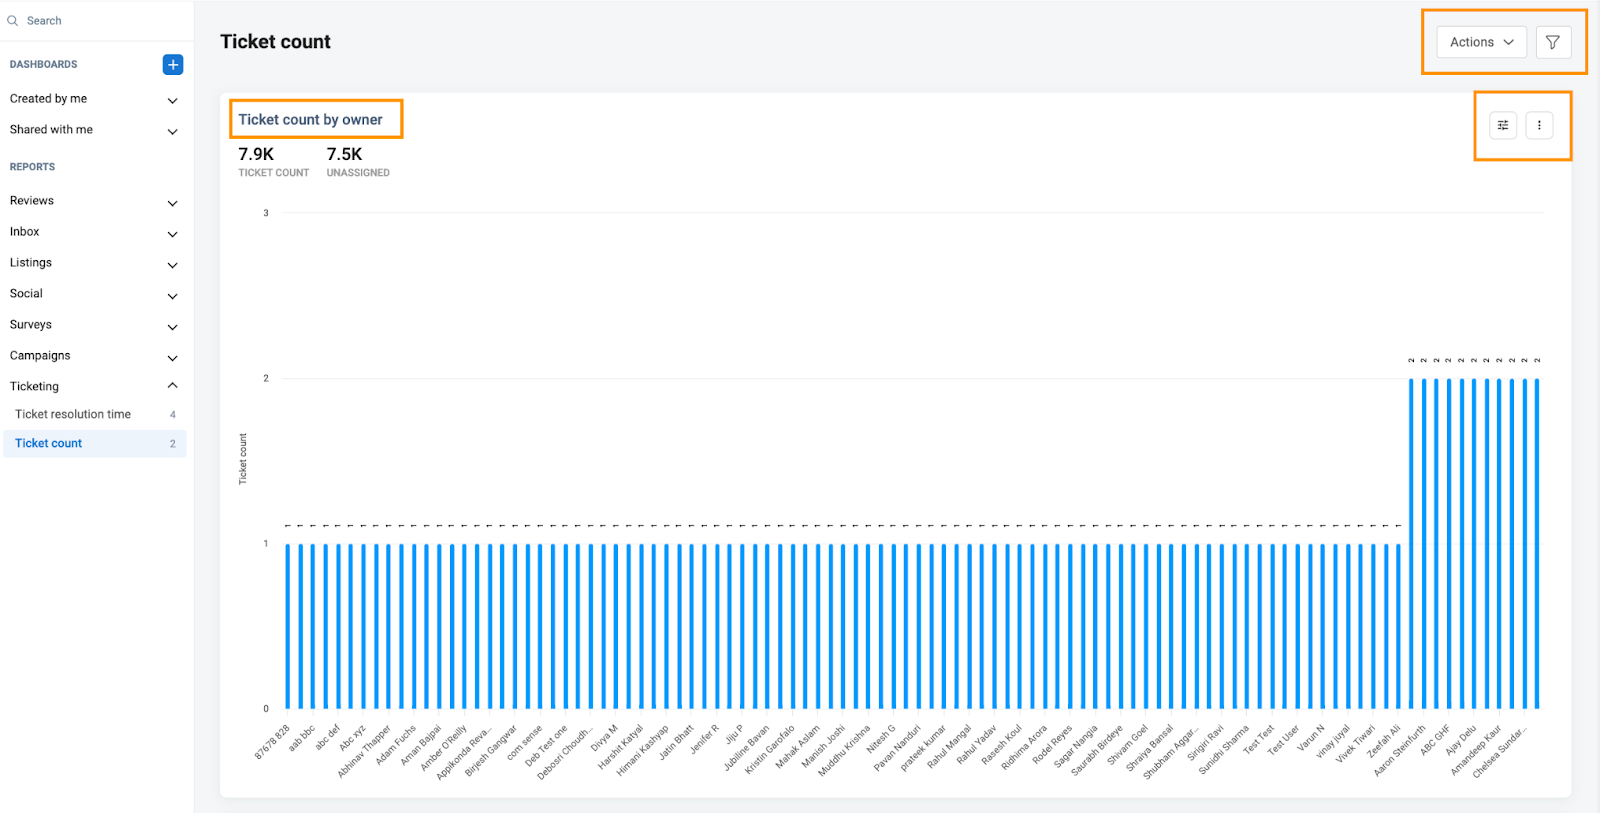
You can also view the report for the number of tickets resolved by owners associated with the Birdeye account. To access the report, click the ‘Ticket count’ option. This report will help you view tickets resolved by different owners with the average resolution time for each owner.
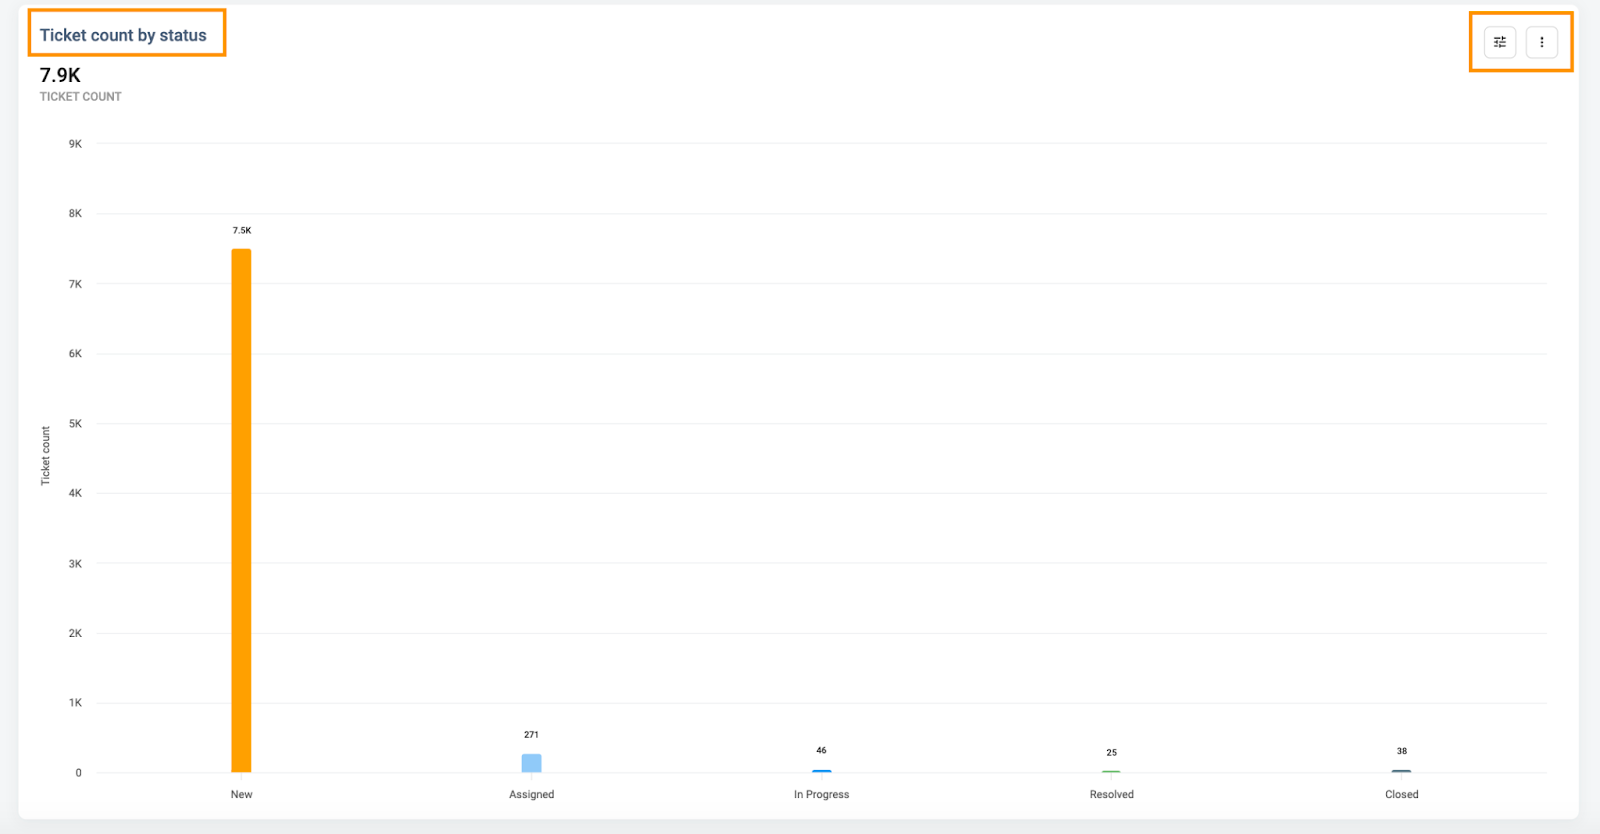
The final report gives you the total ticket count categorized under different statuses. To view the report, scroll down to the 'Ticket count by status' option under the 'Ticketing reports' tab. On this page, you will be able to view the current status of the total tickets created using the account.
