Understanding Inbox reports
Birdeye Inbox reports allow businesses to deepen customer satisfaction by providing them with rich, detailed reporting. Inbox reports provide data for various parameters, including customer interactions and response times, broken out by users and locations.
Inbox reports track the data pertaining to active conversations, received messages, and response times that help you derive actionable insights.
VIEWING INBOX REPORTS
To view the Inbox reports, click on the 'Reports' tab on the left navigation rail of your Birdeye dashboard. Once on the 'Reports' page, click on the 'Inbox' down arrow under the 'Reports' section on the left navigation rail to view the 'Overtime,' 'By location,' and 'By users' reports.
Pre-set reports configured for various types of analyses. All the reports track the following information:
- Median response time
- Active conversation count
- Received messages count
MEDIAN RESPONSE TIME
This shows the time your business usually takes to respond to a customer when they contact you for the first time. It's important to track the median time to improve your response times and make sure that the customers aren't waiting too long. The count begins the moment a conversation is initiated during business hours and keeps running until the conversation is responded to.
Once you are on the 'Inbox reports' page, you can view the historical data aggregated within your account. Use the filters on the right to see the data based on region, city, zip, and location.
Select the funnel-shaped icon labeled 'Global filters,' and you'll access the 'Filter by' section to apply filters, allowing you to slice and dice the data for more effective analysis.
Additionally, a customization icon allows you to personalize the report. The three-dot icon provides options to download, email and schedule the report. Additionally, it offers functionality to add this report to your personally created dashboard.
To personalize the report, simply click on the 'Customization' icon, and a pop-up screen will appear.
Chart Style: You can enhance the visual appeal of your report by selecting different chart styles for optimal viewing.
Displayed by: Daily, Weekly, Monthly, Quarterly and Yearly.
Filters:
- All locations: You can select any location.
- Past 12 months: You can select the report at any time, as shown in the image.
- Source: Google, Facebook, Webforms, Email, etc.
- Contact Type: Select the contact type from the options available.
- Survey Score: You can filter the report on the basis of the survey score.
- Experience Score: The experience score enables you to understand the customer’s current level of happiness and tailor messaging and campaigns accordingly. You can filter the report on the basis of experience score.
Compare data: The ability to compare reports in two dimensions: by location and by date range. Now, you have the flexibility to make insightful comparisons within your reports.
After making customizations, click on 'Update' to apply and save the changes to the report.
To learn about understanding creating dashboards within the 'Reports' section, incorporating multiple reports across all modules, refer to the article: A comprehensive guide to Birdeye Dashboards.
- Email: You can get the report in PDF and XLS formats.
- Schedule: Schedule the report via email in both PDF and XLS formats. You can also set the frequency.
- Download: You can download the report in Excel and PDF formats.
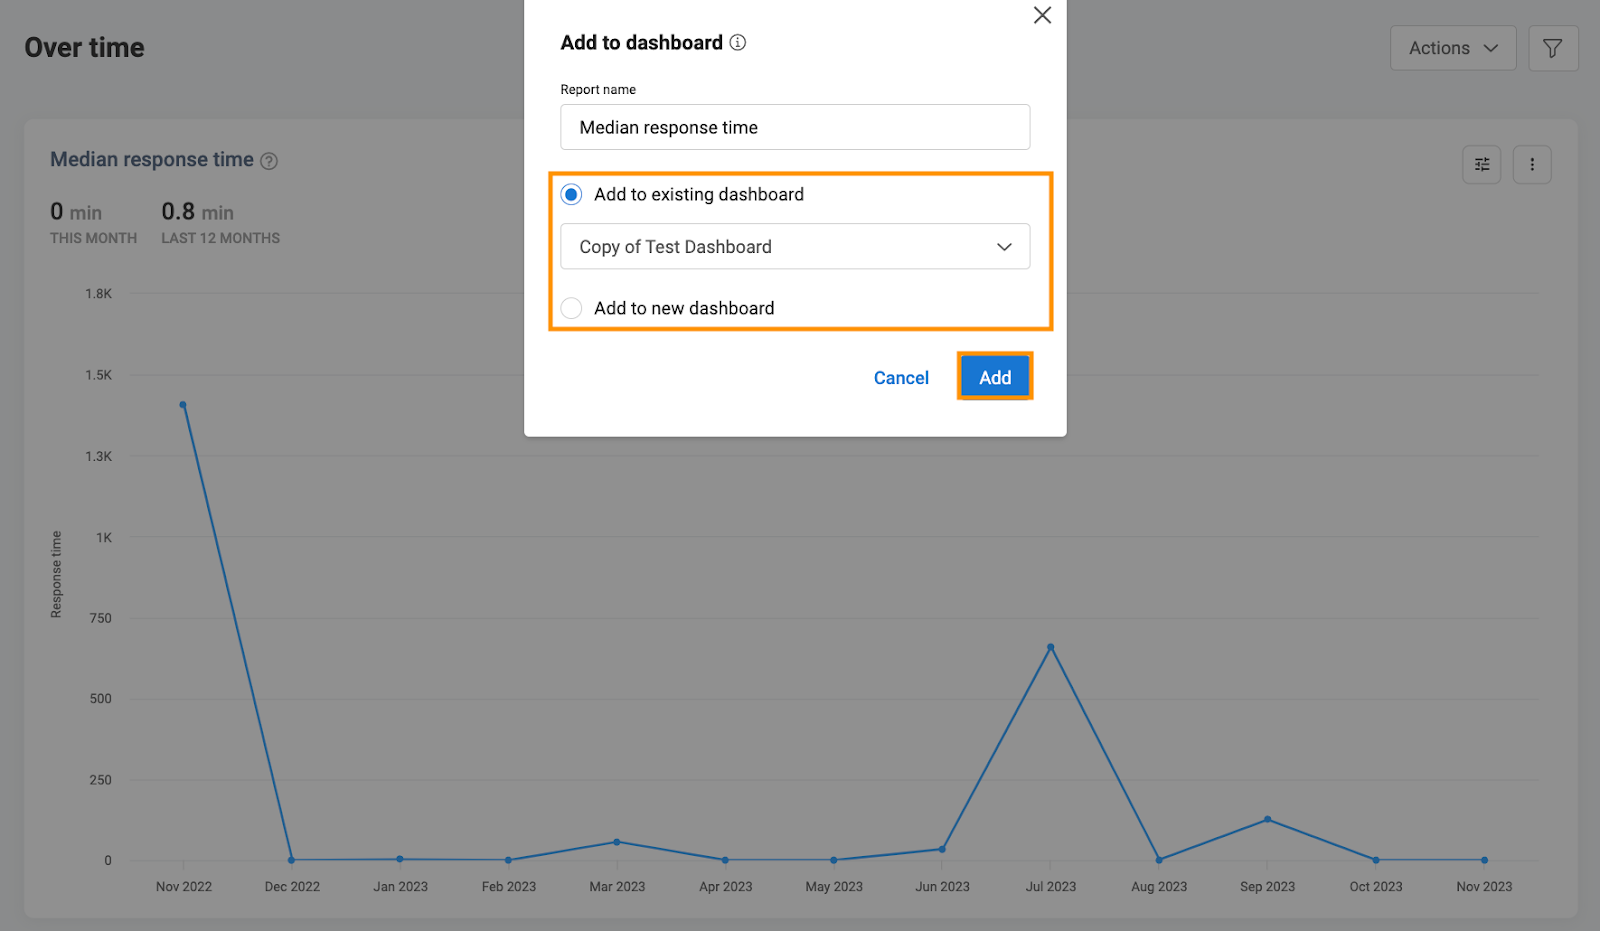
- Add to dashboard: You have the option to add this report to your dashboard. Upon clicking, a pop-up will appear on your screen, allowing you to add it to an existing dashboard or create a new one. Once you've made your selection, click 'Add' to include it in your preferred dashboard.
SOURCE FILTER
Birdeye allows businesses to segregate their reports via source. This filter helps businesses identify sources that are generating more leads and driving more traction. The obtained data can be used for better resource allocation.
The source filter is applicable on all Inbox reports including Over time, By locations, and By users. Businesses can rely on source filters to segregate varied reports from unique channels like Apple Messages, Appointment, Webforms, Email, Text, Webchat, Facebook, and Instagram.
ACTIVE CONVERSATIONS
This is the total number of active inbox conversations your business has with the customers.
Active conversations include messages sent via emails, texts, voice calls, video calls, Facebook Messenger, and Webchat. You can view active conversations in 'Chart' and 'Table' formats.
RECEIVED MESSAGES
This is the total number of messages received by the business via emails, texts, voice calls, Facebook Messenger, and Webchat to date across different business locations. You can view the data 'Over time' and 'By locations' only.


